Spectral Envelope
The spectral envelope is a tool to study cyclic behaviors in categorical data. It is more informative than the traditional approach of attributing a different number to each category for power-spectral density estimation.
For each frequency in the spectrum, the spectral envelope finds an optimal real-numbered mapping that maximizes the normed power-spectral density at this point. Therefore, no matter what mapping is choosen for the different categories, the power-spectral density will always be bounded by the spectral envelope.
The spectral envelope was defined by David S. Stoffer in DAVID S. STOFFER, DAVID E. TYLER, ANDREW J. MCDOUGALL, Spectral analysis for categorical time series: Scaling and the spectral envelope.
Main functions
spectral_envelope — Function
spectral_envelope(ts; m = 3)
Computes the spectral envelope of an input categorical time-series.
The degree of smoothing can be chosen by the user.
Parameters:
- ts (Array{Any,1}): 1-D Array containing input categorical time-series.
- m (Int): Smoothing parameter. corresponds to how many neighboring points are to be involved in the smoothing (weighted average). Defaults to 3.
Returns:
(freq, se, eigvecs), withfreqthe frequencies of the power-spectrum,se
the values of the spectral envelope for each frequency in 'freq'.eigvecscontains
the optimal real-valued mapping for each frequency point.
get_mappings — Function
get_mappings(data, freq; m = 3)
Computes, for a given frequency freq, the optimal mappings for the categories in data. Scans the vincinity of freq to find the maximum of the spectral envelope, prints a sum up and returns the obtained mappings.
Parameters:
- data (Array{Any,1}): 1-D Array containing input categorical time-series.
- freq (Float): Frequency for which the mappings are wanted. The vincinity of 'freq' will be scanned to find maximal value of the spectral envelope.
- m (Int): Smoothing parameter. corresponds to how many neighboring points are to be involved in the smoothing (weighted average). Defaults to 3.
Returns:
mappings, the optimal mappings for the found maxima around 'freq'.
Example
Applying the spectral envelope to study a segment of DNA from the Epstein-Barr virus and plotting the results:
using DelimitedFiles, Plots
using CategoricalTimeSeries

data_path = joinpath(dirname(dirname(pathof(CategoricalTimeSeries))), "test", "DNA_data.txt")
data = readdlm(data_path, ',')
f, se, eigvecs = spectral_envelope(data; m = 0)

plot(f, se, xlabel = "Frequency", ylabel = "Intensity", title = "test data: extract of Epstein virus DNA", label = "spectral envelope")
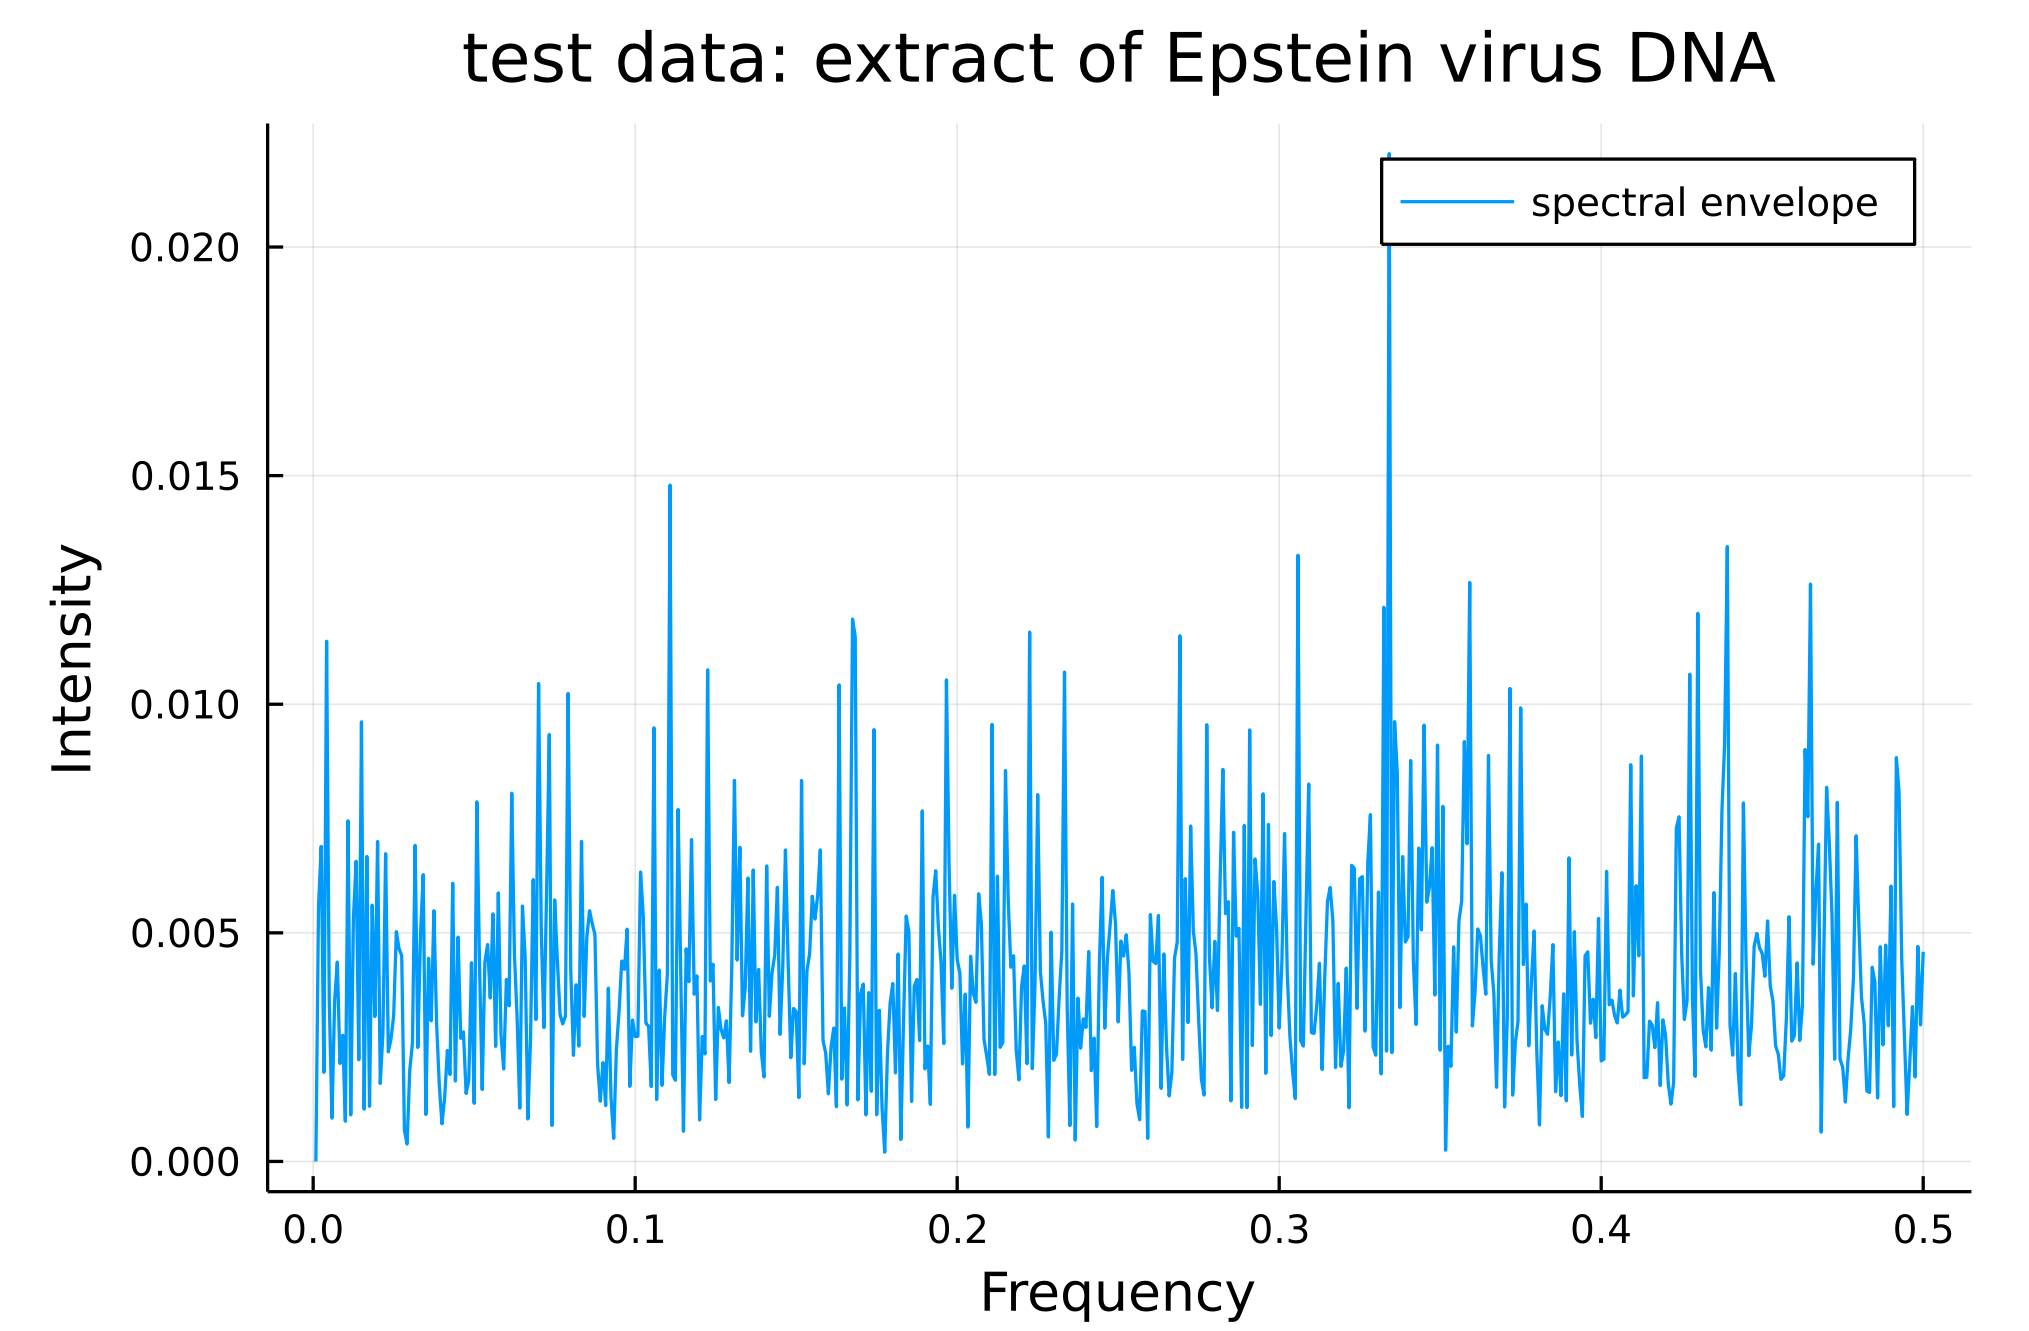
To get the associated optimal mapping for the peak at frequency 0.33:
mappings = get_mappings(data, 0.33; m = 0)
>> position of peak: 0.33 strengh of peak: 0.02
print(mappings)
>> Dict{SubString{String}, Float64} with 4 entries:
  "A" => -0.59
  "T" => 0.55
  "C" => 0.0
  "G" => 0.6