Correlations
The study of categorical data prevents the usage of standard tools like the autocorrelation function, as they are often not defined. The following functions provide ways to study categorical serial dependences.
Most of these methods are described in C. Weiss's book "An Introduction to Discrete-Valued Time Series" (2018).
Main functions
cramer_coefficient — Function
cramer_coefficient(series, lags)
Measures average association between elements of series at time t and time t + lags. Cramer's V is an unsigned measurement : its values lies in [0,1], 0 being perfect independence and 1 perfect dependence. k can be biased, for more informations, refer to [1].
Parameters:
- series (Array{Any,1}): 1-D Array containing input categorical time-series.
- lags (Array{Int,1}): lag values at which cramer's coefficient is computed. Alternatively,
lagscan be an integer, a single integer value will then be returned.Returns:
V, the value of cramer's coefficient for each value inlags.
cohen_coefficient — Function
cohen_coefficient(series, lags)
Measures average association between elements of series at time t and time t + lags.
Cohen's k is a signed measurement : its values lie in [-pe/(1 -pe), 1], with positive (negative) values indicating positive (negative) serial dependence at lags. pe is probability of agreement by chance.
Parameters:
- series (Array{Any,1}): 1-D Array containing input categorical time-series.
- lags (Array{Int,1}): lag values at which Cohen's coefficient is computed. Alternatively,
lagscan be an integer, a single integer value will then be returned.Returns:
K, the value of Cohen's coefficient for each value inlags.
theils_u — Function
theils_u(series, Lags)
Measures average portion of information known about series at t + lags given that series is known at time t. Theil's U makes use of concepts borrowed from information theory
U is an unsigned measurement: its values lies in [0,1], 0 meaning no information shared and 1 complete knowledge (determinism).
Parameters:
- series (Array{Any,1}): 1-D Array containing input categorical time-series.
- lags (Array{Int,1}): lag values at which Theil's U is computed. Alternatively,
lagscan be an integer, a single integer value will then be returned.Returns:
U, the value of Theil's U for each value inlags.
Confidence interval
Depending on the length of the time-series and the method used, the estimated value of serial dependence might fluctuate a lot around its true value. It is therefore useful to relate estimations to a corresponding confidence interval to know how significant given results are. The following function provides a confidence interval via bootstrap:
bootstrap_CI — Function
bootstrap_CI(series, lags, coef_func, n_iter = 1000, interval_size = 0.95)
Returns a top and bottom limit of the confidence interval at values of lags. The width of the confidence interval can be choosen (defaults to 95%). The returned confidence interval corresponds to the null hypothesis (no serial dependence), if the estimated serial dependence lies in this interval, no significant correlations can be claimed.
Parameters:
- series (Array{Any,1}): 1-D Array containing input categorical time-series.
- lags (Array{Int,1}): lag values at which the CI is computed.
- coef_func (function): the function for which the CI needs to be computed.
coef_funccan be one of the following functions :cramer_coefficient,cohen_coefficientortheils_U.- n_iter (Int): number of iterations for the bootstrap procedure. The higher, the more precise but more computationaly demanding. Defaults to 1000.
- interval_size (Float): Desired size of the confidence interval. Defaults to 0.95, for a 95% confidence interval.
Returns:
(top_values, bottom_values), the top and bottom limit for confidence interval, for each point inlags.
Example
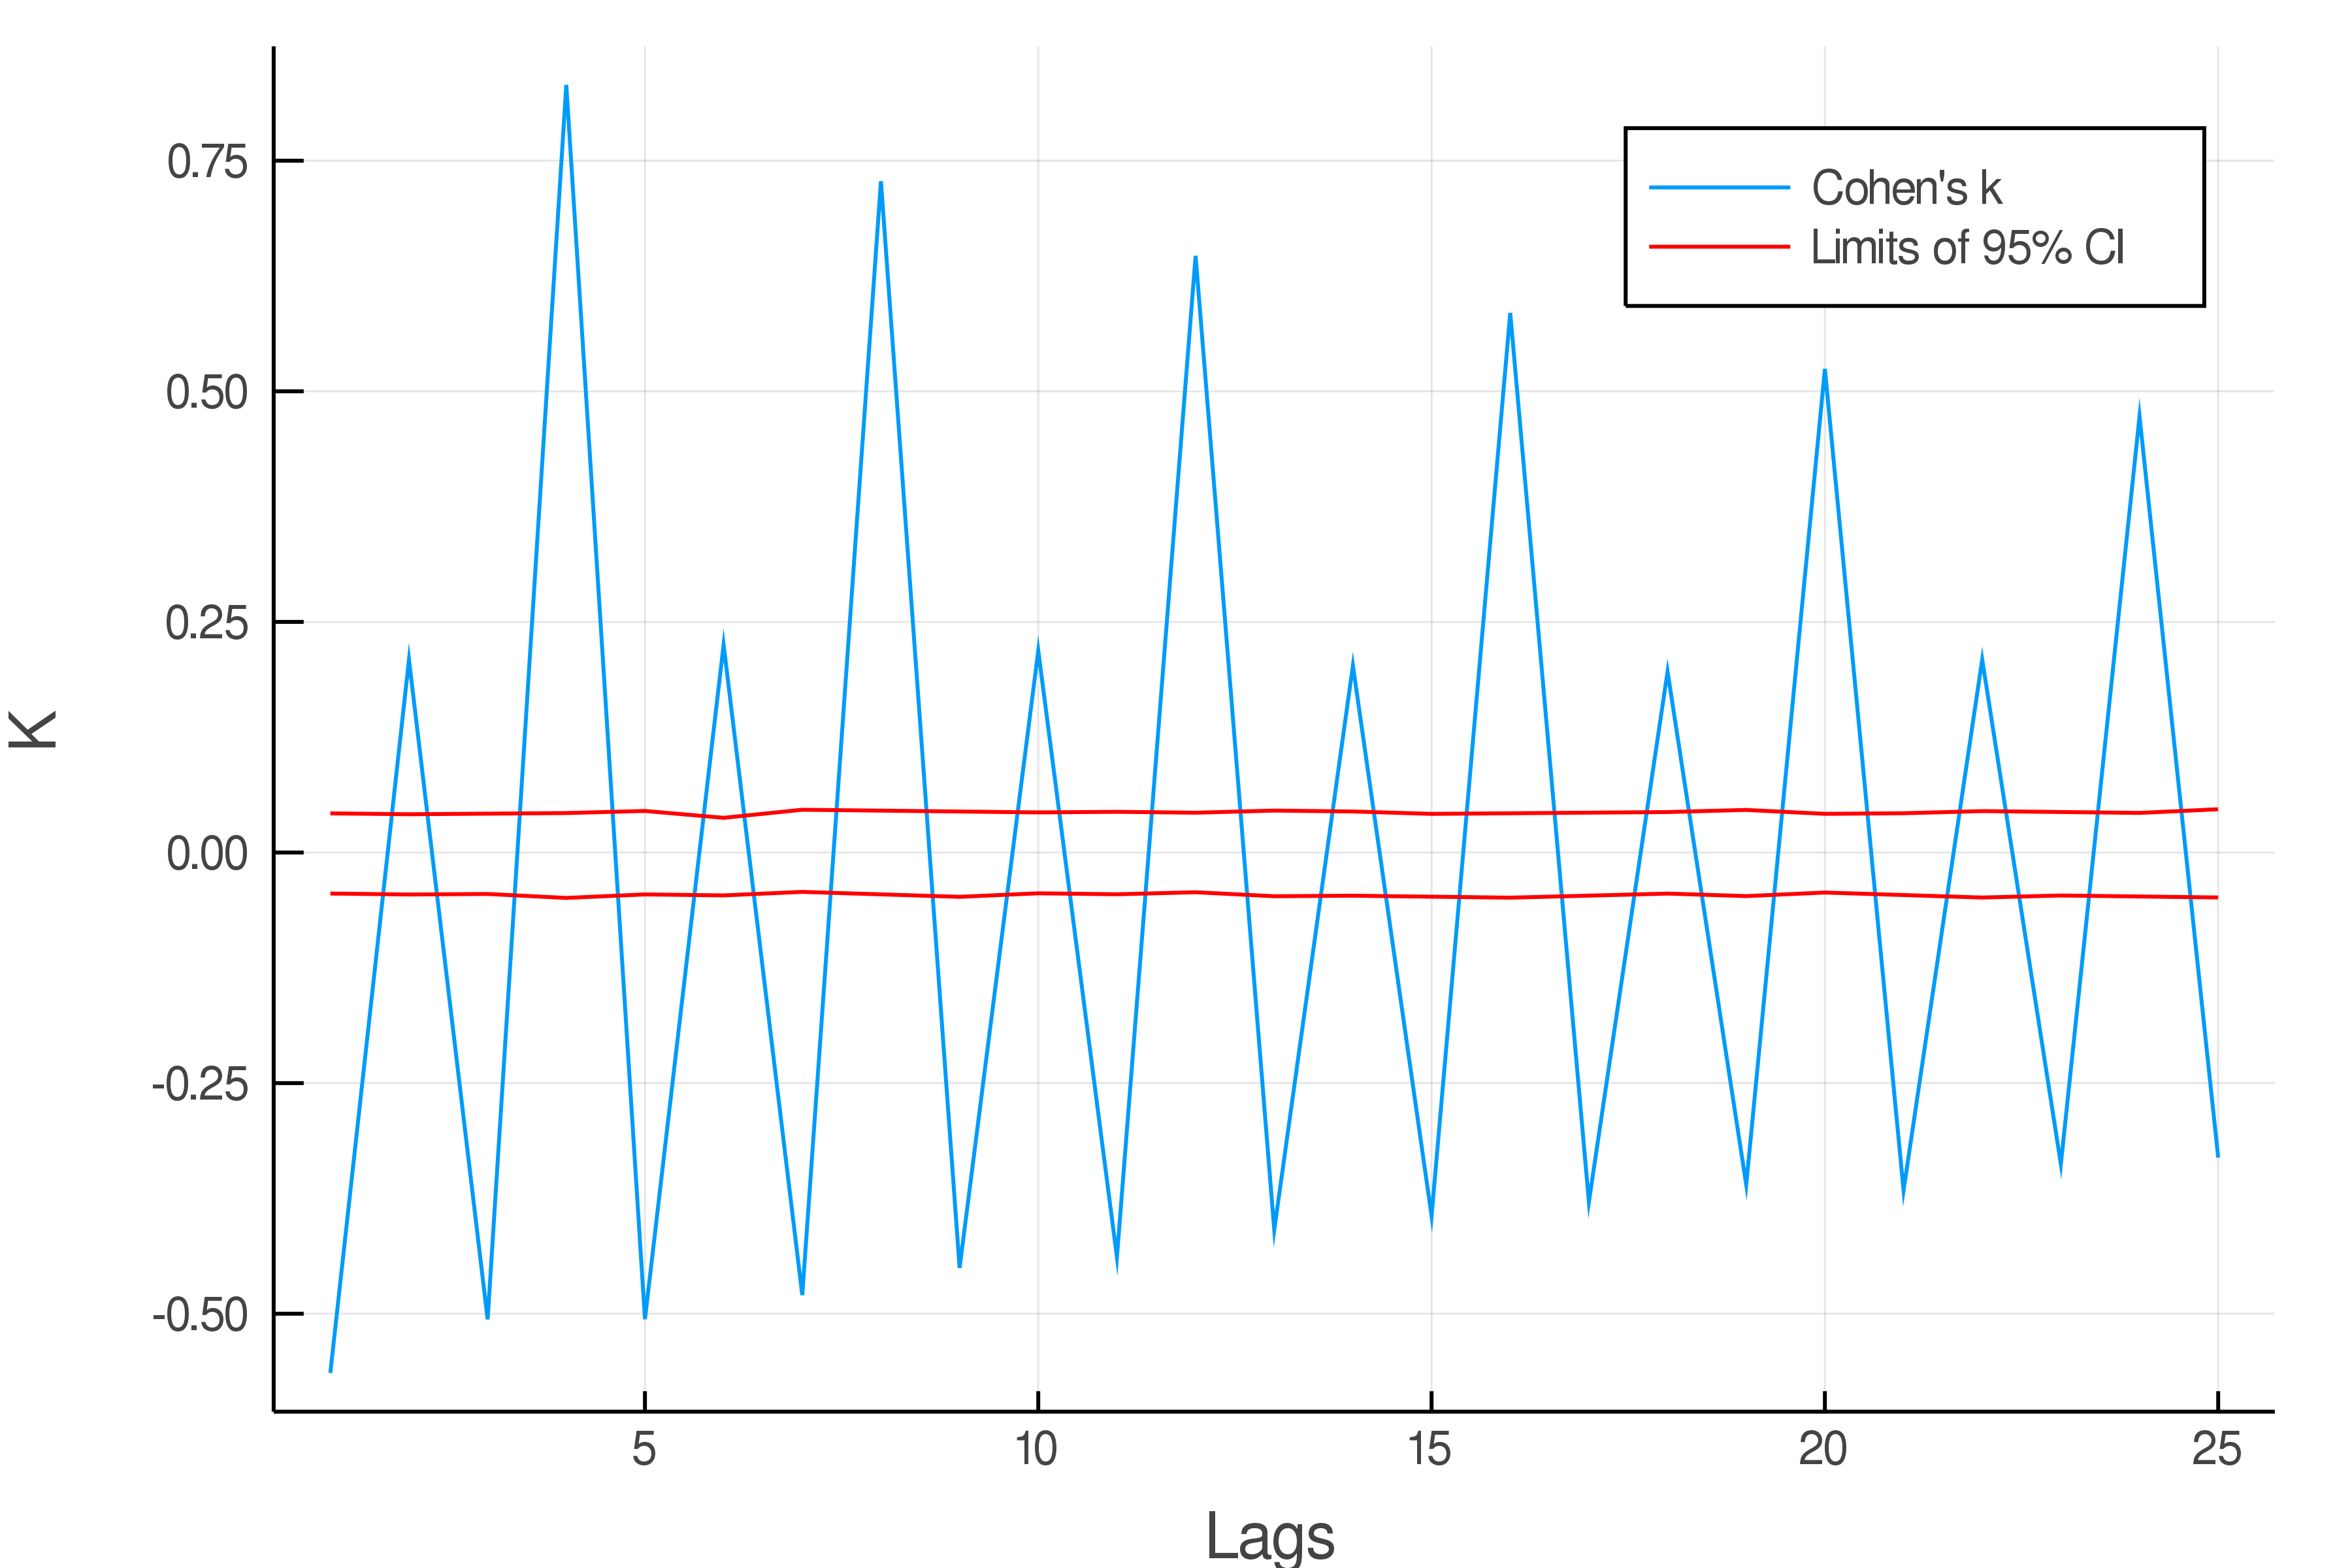
Using the Pewee birdsong data (1943) one can do a serial dependence plot using Cohen's cofficient as follow :
using DelimitedFiles, Plots
using CategoricalTimeSeries

#reading 'pewee' time-series test folder.
data_path = joinpath(dirname(dirname(pathof(CategoricalTimeSeries))), "test", "pewee.txt")
series = readdlm(data_path,',')[1,:]
lags = collect(1:25)
v = cohen_coefficient(series, lags)
t, b = bootstrap_CI(series, lags, cohen_coefficient)
a = plot(lags, v, xlabel = "Lags", ylabel = "K", label = "Cohen's k")
plot!(a, lags, t, color = "red", label = "Limits of 95% CI"); plot!(a, lags, b, color = "red", label = "", dpi = 600)